ANALYSIS
Analysis
Each plant has a chemical 'fingerprint' - analytical chemistry is a tool with which we can interpret these 'fingerprints'. We may look at a mixture as a whole, or separate out its chemical constituents to look at compounds individually.
Each plant has a chemical 'fingerprint' - analytical chemistry is a tool with which we can interpret these 'fingerprints'. We may look at a mixture as a whole, or separate out its chemical constituents to look at compounds individually.
Analytical tools are, generally: chromatographic - where compounds are separated according to their affinity for either a solvent or for a solid material or, spectroscopic - where compounds are separated according to their atomic mass, charge and light absorbance.
Chromatography and spectroscopy record information about chemical compounds using detectors which convert this information into spectra. Spectra, allow us to visualize information from a detector as peaks which correspond to the abundance of compounds in a mixture.
Spectroscopic methods also include Nuclear Magnetic Resonance (NMR) – which can identify the position of hydrogen and carbon atoms in a compound and provide information about a compound’s stereochemistry. In recent years researchers have developed ‘hyphenated’ techniques, which combine chromatography and spectrometry to offer a more complete analysis.
Chromatography
Chromatography can be either analytical - to simply work out what is in a mixture - or preparative – in which compounds can be separated and collected into fractions for further purification. In many instances analysis and preparative work are carried out simultaneously.
Chromatography can be either analytical - to simply work out what is in a mixture - or preparative – in which compounds can be separated and collected into fractions for further purification. In many instances analysis and preparative work are carried out simultaneously.
Thin Layer Chromatography (TLC)
– In TLC, compounds within a solvent (the mobile phase) bind at different positions on a layer of silica or paper (the stationary phase) where they separate into ‘bands’ according to their relative affinity to the mobile or stationary phase. These bands can be visualized, as below, either by the naked eye or under UV light.
High performance Liquid Chromatography (HPLC)
– in an HPLC system (above) samples are injected in solvent at very high pressure through a narrow column. Compounds bind to the column for shorter or longer periods – depending on their relative polarity. The times taken for compounds to pass through the column are called retention times. These retention times are detected by a UV detector and ‘translated’ into a chromatogram on a computer attached to the HPLC equipment.
High-performance Thin-Layer chromatography (HPTLC) - is used in industry for analysis and product standardization. HPTLC offers the speed and convenience of TLC but, due to the thinness (≤150 μm) and particle size (≤10 μm) of the stationary phase, it is capable of producing far better resolution than TLC.
Spectroscopy
Mass Spectrometry (MS)
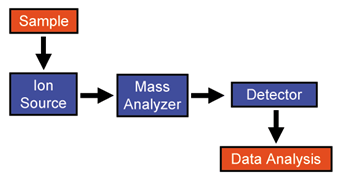
is one of the most widely used spectroscopic (or more precisely spectrometric) techniques. In a mass spectrometer a sample is bombarded with either positively charged or negatively charged ions causing it to fragment and the fragments are recorded by a detector, which calculates the fragments’ mass/charge ratio and abundance and converts this data into spectra.
Nuclear Magnetic Resonance (NMR)
– when atoms are exposed to a magnetic field in an NMR device this ‘excites’ the atoms - causing them to spin. According to their positions atoms are shielded or de-shielded from the magnetic field and their degree of spinning differs accordingly. We call this degree of spinning chemical shift. In NMR, data produced from the detection of chemical shift in nuclei can be translated into a 'map' of atom positions in a compound.
NMR can detect only hydrogen 1H; carbon 13C or nitrogen 15N isotopes – but, as carbon (and usually hydrogen) is present in all organic compounds, NMR can be a very useful tool to add precision to an analysis.
In the example opposite we see how chemical shift can be interpreted to determine hydrogen atoms’ positions in different regions of a compound (ethanol - C2H5OH).


